Count Your Carbon 2026-27 is now live – what’s new for this year?
Count Your Carbon is now live for the 2026-27 academic year, and with it we’re bringing you some new updates which we hope will make your experience using the tool easier than ever.

-
One report, updated throughout the year
Instead of having the option to produce multiple reports annually, you’ll now maintain a single carbon footprint report throughout the year. If you’ve already submitted your report and obtain new data later on, simply click the ‘Reopen’ button on your dashboard to update your existing report. Prefer to start from scratch? No problem. Just select ‘Start new’ on your dashboard instead to overwrite your previous report.
This approach makes it easier to keep track of your annual carbon reporting and helps us gather more accurate data, improving our ability to report on school carbon emissions.
-
View your answers for previous reports
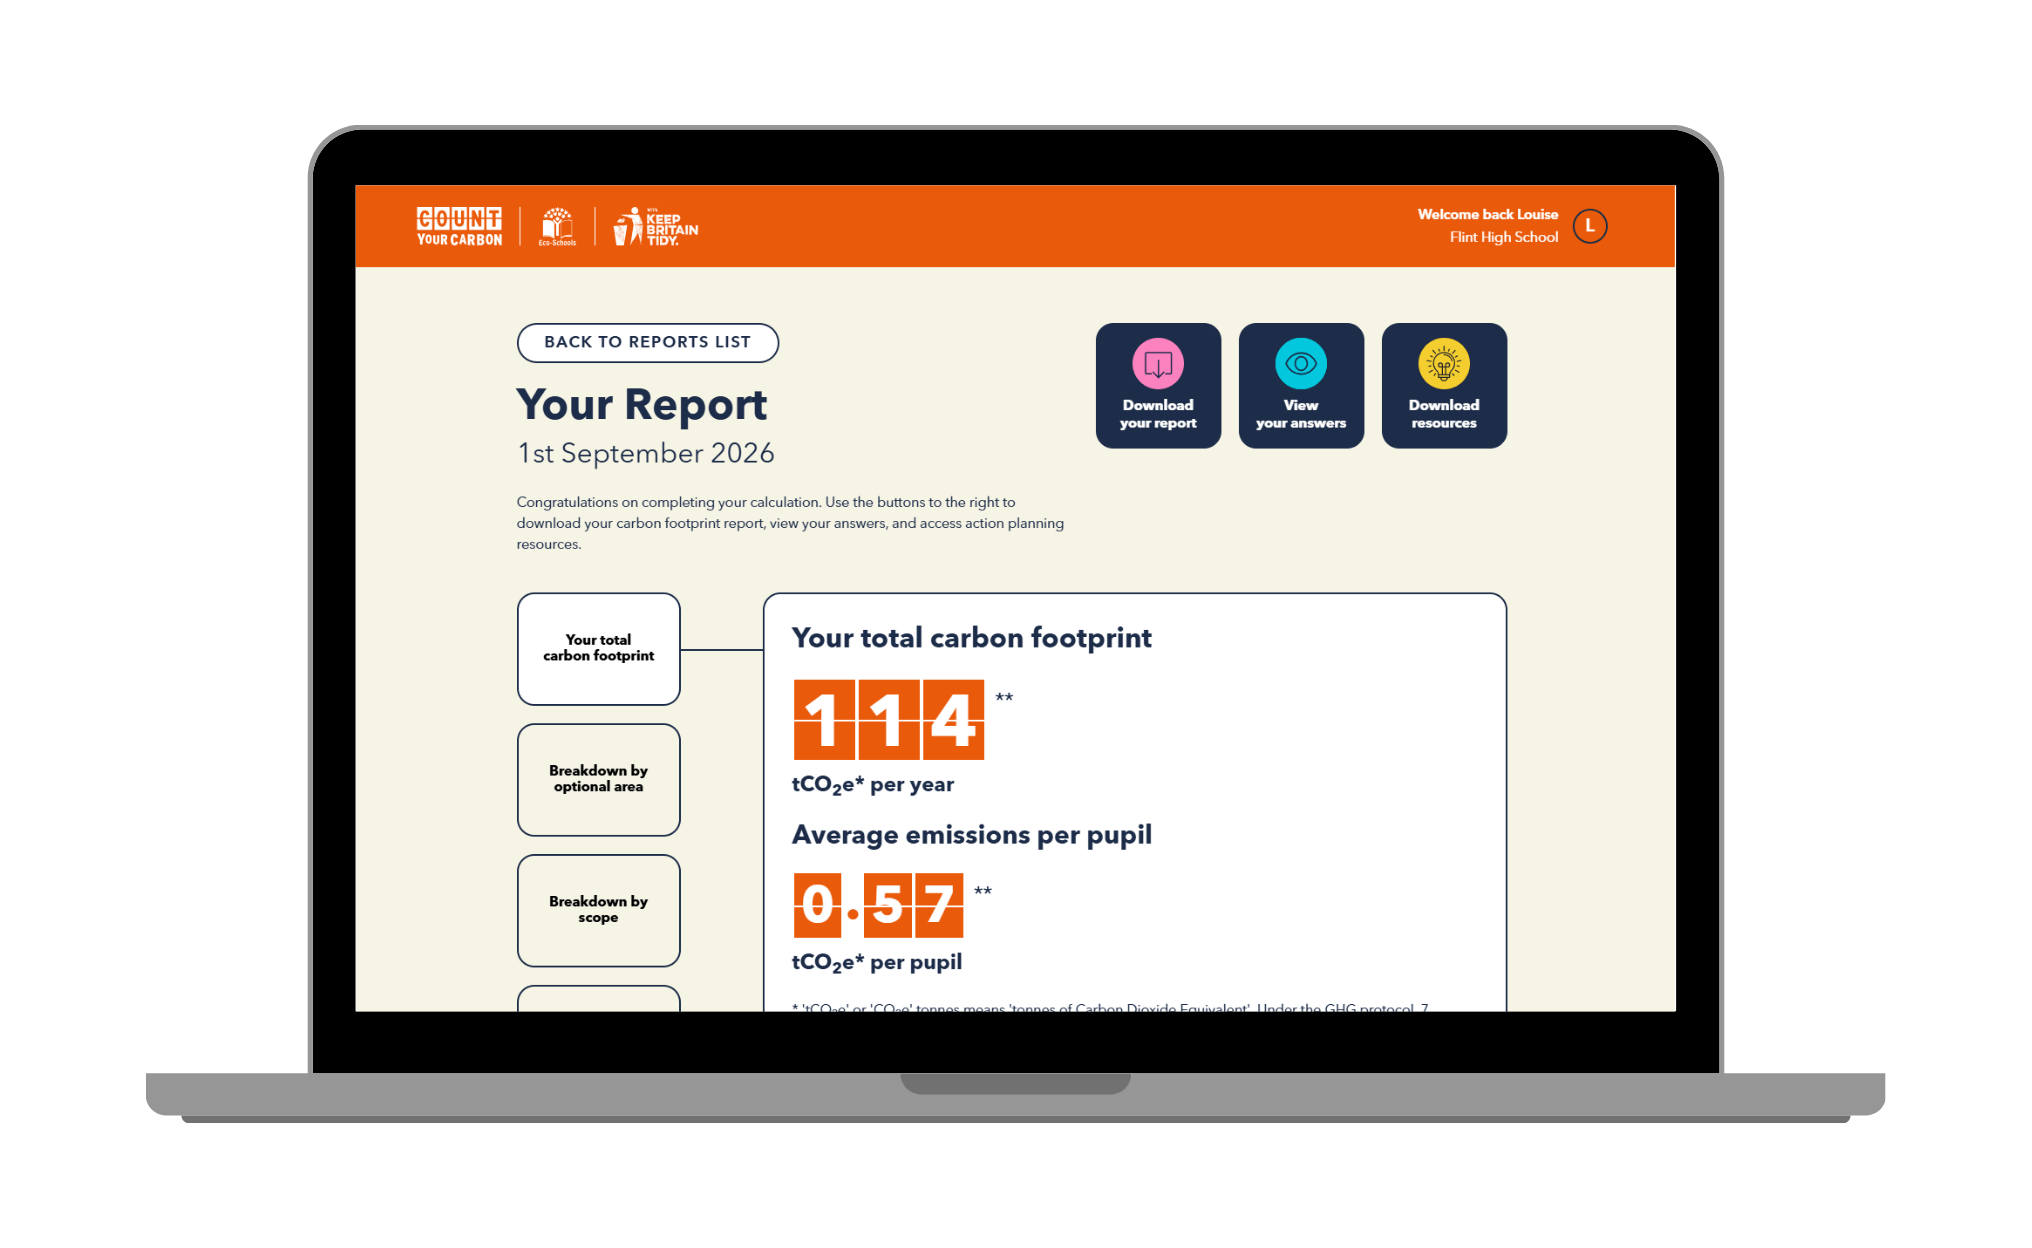
A much-requested feature is finally here! You can now review all the answers you submitted for your carbon footprint reports. Simply head to the reports list, enter the reporting dashboard for your chosen report, and click ‘View your answers’ to access the data used to produce your report.
-
Improved reporting dashboard
The reporting dashboard now includes per-pupil figures throughout, making it easier for you to understand your results. You’ll also find a new tab that provides a breakdown of your carbon footprint across emissions scopes.
-
We’ve refreshed our data gathering resource
The Data Collection Sheet has been updated to reflect minor changes we’ve made for the upcoming academic year. Make sure you’re using the most up to date version of the spreadsheet to make completing your calculation as straightforward as possible.
Click here to read the updated data gathering guidance and download the Data Collection Sheet
-
Quicker and easier data entry for trips
We’ve made some changes to the way you enter trips data to help save you time. Instead of adding each trip on a separate line, you’ll now enter the total mileage and average number of people travelling for each mode of transport. This means you’ll only need to enter a maximum of four lines of data for each trips question.
We’ve also updated our Data Collection Sheet to reflect this new approach. Simply record your trips individually in the relevant trips tabs, and the sheet will automatically calculate the total mileage and average number of people for you. When it’s time to enter your data into the system, you’ll have everything you need ready to go, making the process quicker and easier than ever.
This doesn’t change how your trips emissions are calculated, so your annual reports will remain comparable.
-
We’ve updated the built-in averages
The built-in averages, which allow you to use estimates where you can’t provide data, have been refined based on data from over 4000 carbon footprint reports. This means you can have even more confidence in your results where you’ve had to use averages.
To improve the accuracy of the benchmarks, we’ve updated the methodology we use to calculate them. This means that some of the benchmarks have changed more significantly than in previous years.
Click here to read more about the updated benchmarking methodology
-
We’ve updated the emissions factors
The emissions factors have been updated to the 2026 emissions factors. Some of the emissions factors (determined by the government) have changed more significantly than in previous years, which may have a noticeable impact on your calculation. We’ve covered these changes in our methodology guide.
Click here to download the latest Methodology Guide
-
Updated Decarbonisation Planning resources
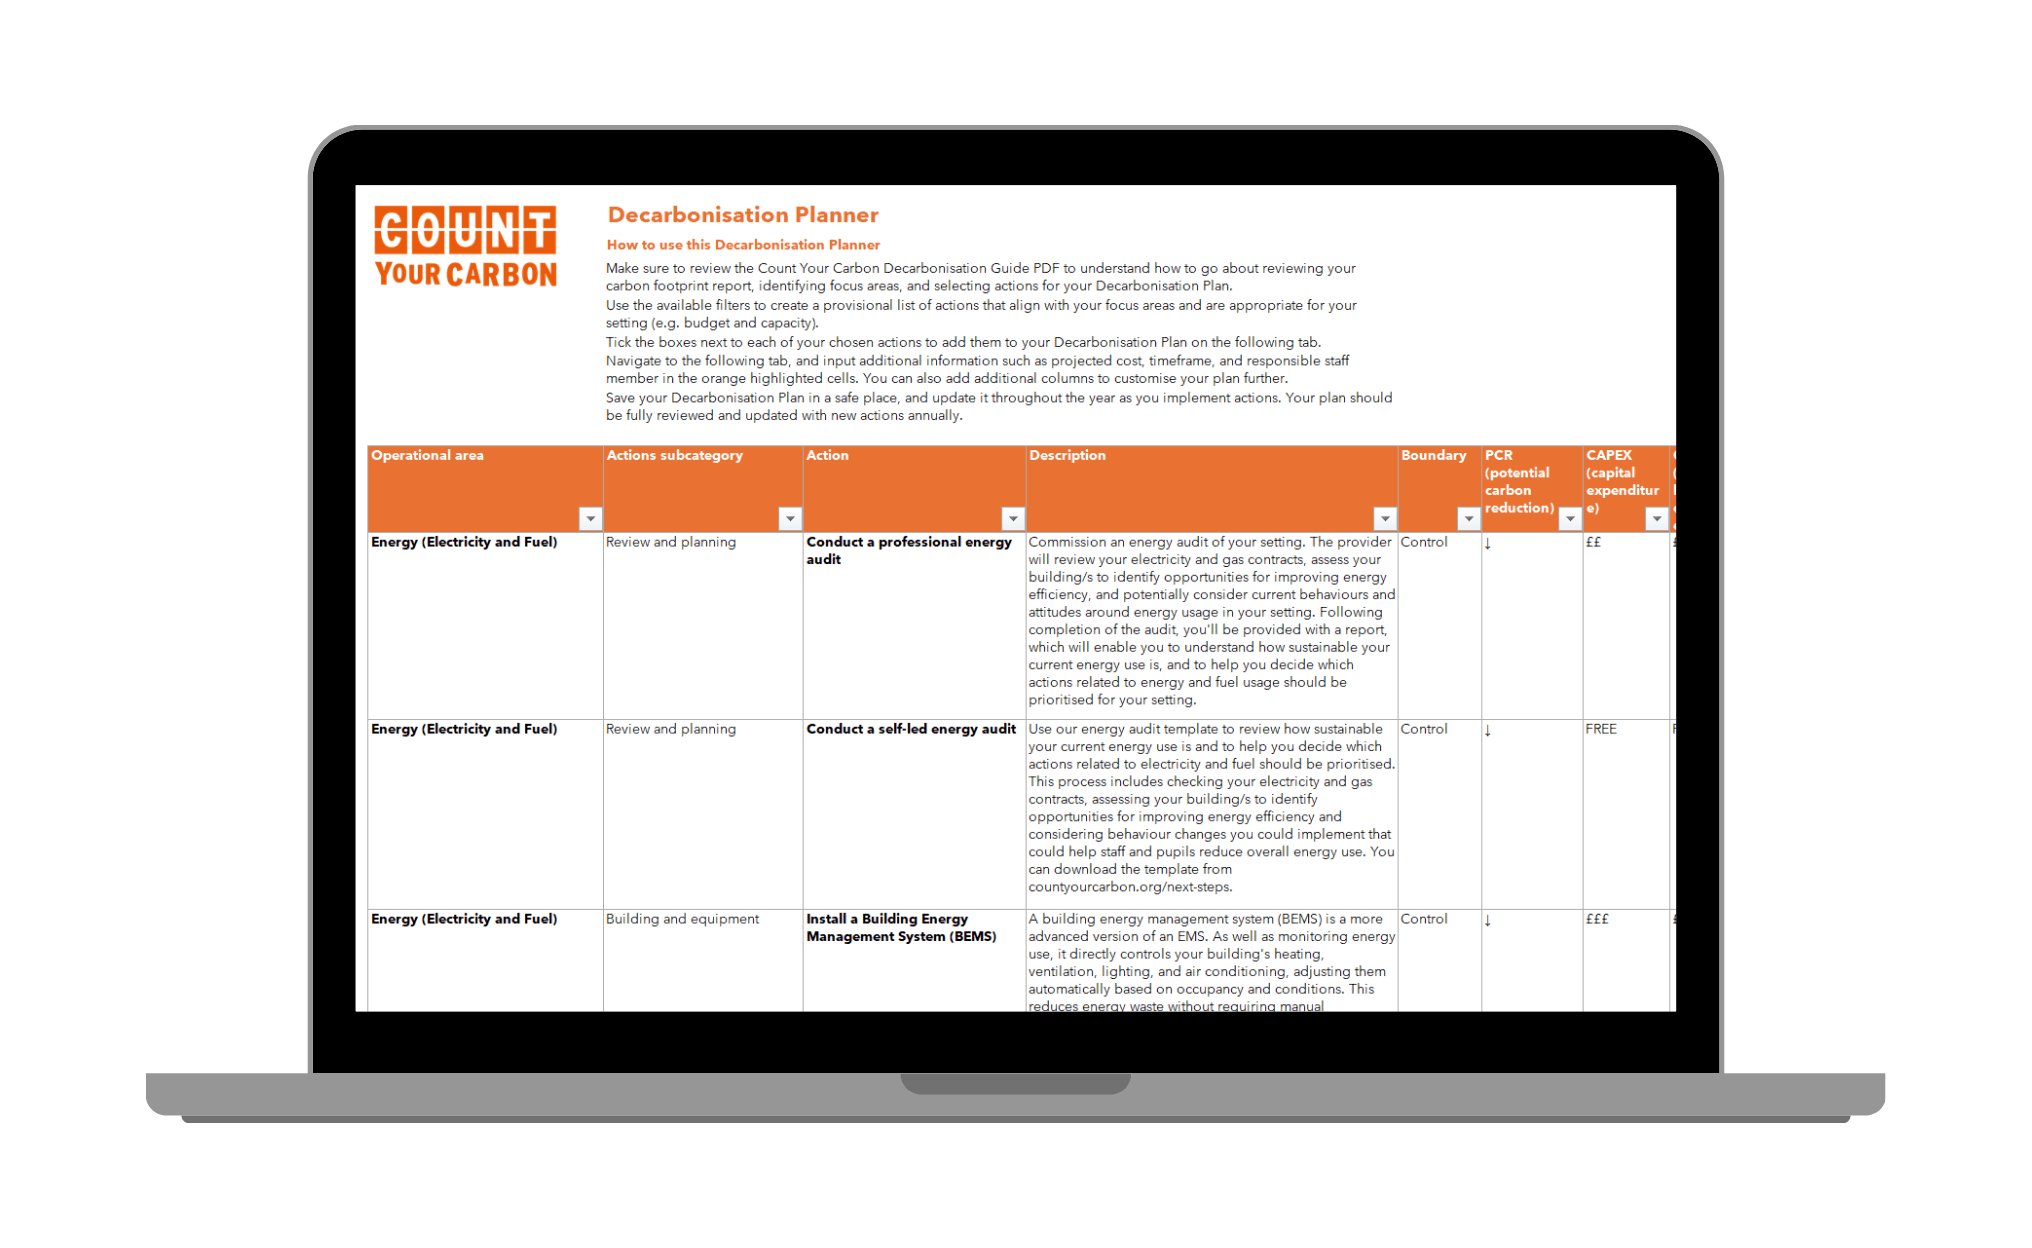
Our Decarbonisation Planner now features more than 100 actions, helping you quickly identify the opportunities that best fit your setting, focus areas, budget, and time constraints.
We’ve also updated our Decarbonisation Guide, creating a more detailed resource to support you throughout the planning process. From reviewing your report to building a fully developed Decarbonisation Plan, the guide provides straightforward guidance from start to finish.
Once you’ve completed a carbon footprint report, you’ll gain access to the updated Decarbonisation Planning resources.
We hope these updates will further improve your experience with Count Your Carbon! Wishing you all the best for the year ahead.
The Eco-Schools Team